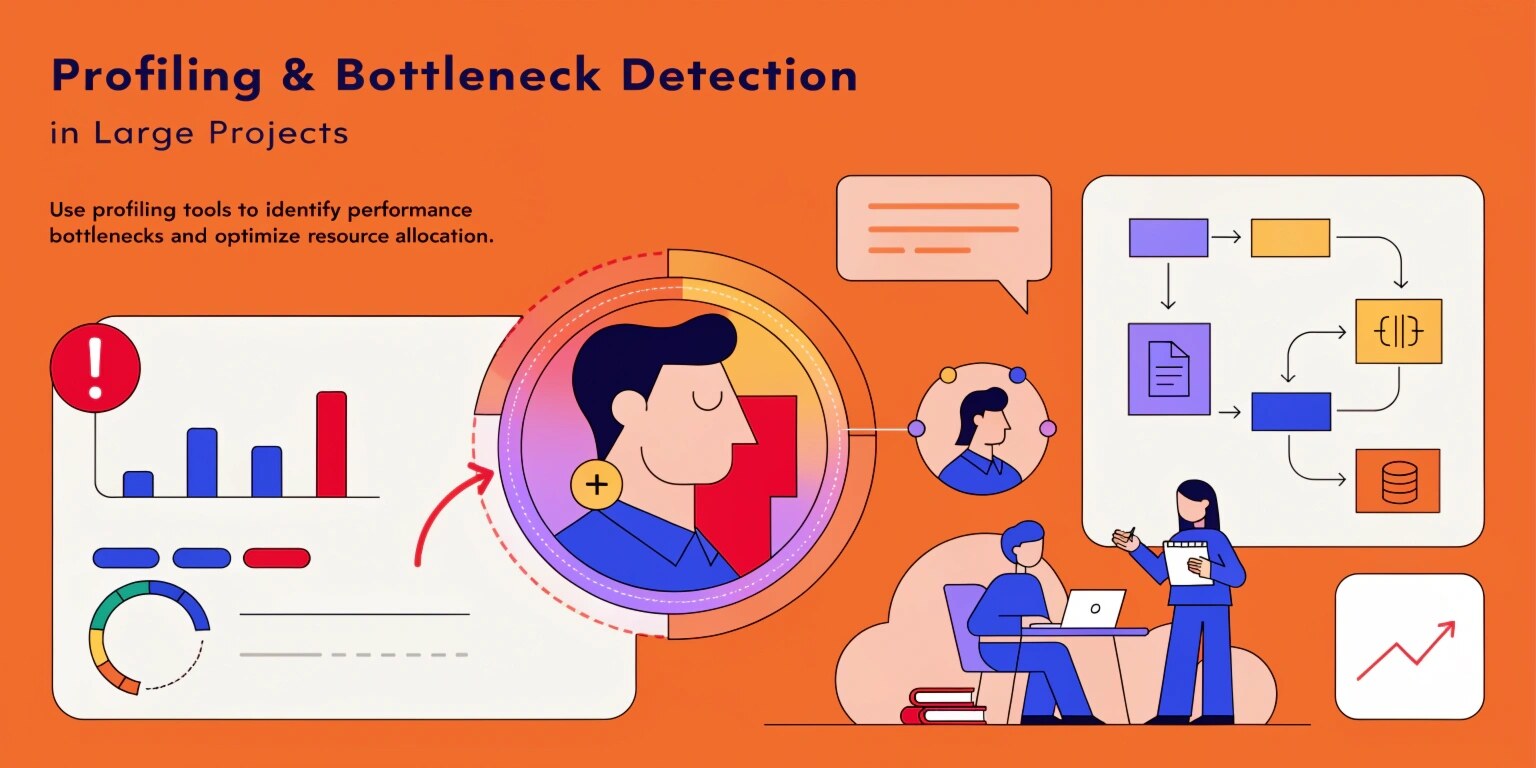
As software systems grow in complexity, maintaining optimal performance becomes increasingly challenging. Large-scale applications often involve multiple services, databases, APIs, cloud resources, and thousands of lines of code. Even a minor inefficiency in one component can impact the overall user experience.
This is where profiling and bottleneck detection become essential. Profiling helps developers understand how applications consume resources, while bottleneck detection identifies the specific areas that limit performance. Together, these practices enable teams to optimize systems, improve scalability, and deliver faster, more reliable applications.
What is Profiling?
Profiling is the process of measuring and analyzing the performance characteristics of an application during execution. It provides detailed insights into how system resources such as CPU, memory, disk I/O, and network bandwidth are utilized.
The primary goals of profiling include:
- Identifying resource-intensive functions
- Measuring execution times
- Detecting memory leaks
- Monitoring database query performance
- Understanding system behavior under load
Rather than relying on assumptions, profiling offers data-driven insights that help developers make informed optimization decisions.
Understanding Bottlenecks
A bottleneck is any component within a system that restricts overall performance. Similar to the narrow neck of a bottle limiting liquid flow, a bottleneck limits the throughput of an application.
Common bottlenecks in large projects include:
CPU Bottlenecks
Complex calculations, inefficient algorithms, and excessive processing can overburden CPU resources.
Memory Bottlenecks
Poor memory management, memory leaks, and excessive object creation can lead to performance degradation.
Database Bottlenecks
Slow queries, missing indexes, inefficient joins, and database contention can significantly impact response times.
Network Bottlenecks
High latency, excessive API calls, and bandwidth limitations can slow communication between services.
Disk I/O Bottlenecks
Frequent read/write operations and inefficient storage access patterns may create performance constraints.
Identifying the actual bottleneck is crucial because optimizing non-critical areas often provides little performance improvement.
Why Profiling Matters in Large Projects
Large applications often contain interconnected components where performance issues may not be immediately visible. Profiling provides visibility into these hidden inefficiencies.
Key benefits include:
- Improved application responsiveness
- Better resource utilization
- Reduced infrastructure costs
- Faster debugging processes
- Enhanced scalability
- Improved user experience
Without profiling, development teams risk spending time optimizing areas that do not significantly impact performance.
Types of Profiling
CPU Profiling
CPU profiling measures processor usage and identifies functions consuming excessive execution time.
Developers can analyze:
- Function call frequency
- Execution duration
- Thread activity
- Computational hotspots
Memory Profiling
Memory profiling helps detect:
- Memory leaks
- Excessive allocations
- Unused objects
- Garbage collection overhead
This type of profiling is especially important for long-running applications and cloud-based services.
Database Profiling
Database profiling focuses on:
- Query execution times
- Index utilization
- Lock contention
- Transaction performance
Optimizing database operations often delivers substantial performance gains.
Network Profiling
Network profiling examines:
- Request latency
- API response times
- Data transfer volumes
- Communication overhead
This is particularly useful in microservice architectures.
Popular Profiling Tools
Several industry-standard tools assist in profiling and bottleneck detection:
Application Profilers
- Visual Studio Profiler
- JetBrains dotTrace
- YourKit Java Profiler
- Perf (Linux)
- Valgrind
Monitoring Platforms
- New Relic
- Datadog
- Dynatrace
- AppDynamics
Database Monitoring Tools
- SQL Server Profiler
- MySQL Performance Schema
- PostgreSQL pg_stat_statements
Cloud Monitoring Services
- AWS CloudWatch
- Azure Monitor
- Google Cloud Operations Suite
These tools provide real-time visibility into application performance and infrastructure health.
Best Practices for Bottleneck Detection
Establish Performance Baselines
Before optimization begins, measure current performance metrics. Baselines help determine whether improvements are actually effective.
Monitor Production Environments
Many performance issues only appear under real-world workloads. Production monitoring helps uncover hidden bottlenecks.
Focus on High-Impact Areas
Apply the Pareto Principle: often 20% of the code causes 80% of performance issues.
Analyze End-to-End Performance
Examine the complete request lifecycle rather than isolated components.
Perform Load Testing
Simulating realistic traffic conditions helps reveal scalability limitations before they affect users.
Common Optimization Strategies
Once bottlenecks are identified, several optimization techniques can be applied:
- Refactor inefficient algorithms
- Implement caching mechanisms
- Optimize database queries
- Reduce network calls
- Introduce asynchronous processing
- Improve indexing strategies
- Scale infrastructure horizontally
- Optimize memory usage
The goal is not simply faster code but a balanced and scalable system architecture.
Real-World Example
Consider an e-commerce platform experiencing slow checkout performance during peak sales events.
Profiling reveals:
- 60% of request time is spent in database queries.
- Several queries perform full table scans.
- Inventory validation triggers multiple redundant API calls.
By adding indexes, optimizing queries, and implementing caching for inventory data, the platform reduces checkout response times by 70%.
This demonstrates how profiling enables targeted improvements instead of guesswork.
Conclusion
Profiling and bottleneck detection are fundamental practices for building high-performing software systems. As projects grow in scale and complexity, performance challenges become inevitable. However, with proper profiling techniques, monitoring tools, and optimization strategies, development teams can identify performance constraints before they become critical issues.
Successful performance optimization is not about making every part of an application faster—it is about finding and improving the components that truly limit system performance. Organizations that embrace profiling as a continuous process can achieve better scalability, lower operational costs, and superior user experiences.